In his recent TED talk, Bono said that extreme poverty could be virtually eliminated by 2030, adding: “2030 is just around the corner. It’s about three Rolling Stones farewell concerts away.”
A new report from Development Initiatives called ‘Investments to End Poverty‘ has projected global poverty levels up to 2030, with incredible results.
The number of extreme poor in 2030 could be anywhere between 100 million and more than 1 billion.
This graphic shows the best case scenario for global poverty by 2030:

While 108 million is still an unacceptable number of people to be living in extreme poverty, that works out at just 1.28% of the projected global population, and would be a 93% decrease in poverty from 2000 levels. A virtual elimination.
To get there, economic growth will not be enough. In sub-Saharan Africa, the poorest people are so deep in poverty that a myriad of interventions are needed, beyond simply increasing their income. 95% of this 108 million would reside in sub-Saharan Africa, showing that this region will be one of the last and most difficult regions to tackle.
To achieve this best case scenario will require strong and committed action from the global community. Without it, the future looks less bright. This graphic shows the worst case scenario in 2030:

If we want to expedite the end of poverty, we need a Data Revolution.
The international community must pay greater attention to data, as it defines the next generation of development goals. Global poverty estimates still rely on outdated, patchy data. 25% of the data on the number of poor people in sub-Saharan Africa is derived from surveys conducted before 2005. Without better information, resources cannot be optimally allocated, progress cannot be properly followed, and lessons cannot be learned.
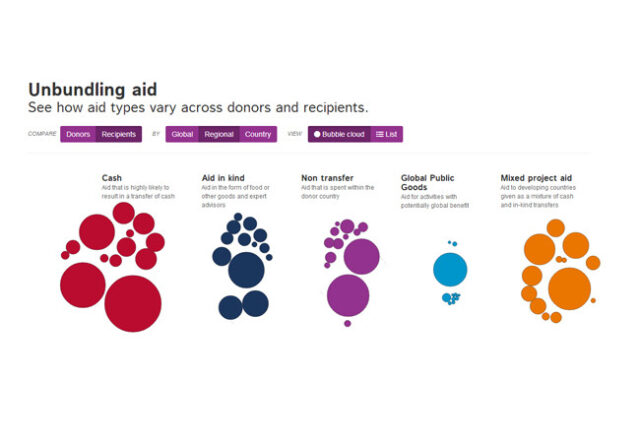
‘Investments to End Poverty’ also takes an in-depth look at how aid flows have changed over time, and how that aid is actually delivered to developing countries. See the visualisations for these data sets in this blog post.
You can also explore the variations in projected global poverty levels at Development Initiatives or download the full report.


