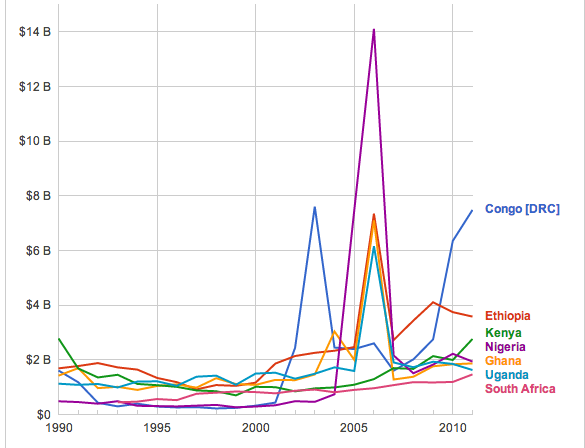
This graphic shows how international aid to selected African countries has changed over time. You can compare different countries or types of aid by clicking ‘Explore data’ in the corner of the graphic.
It’s part of an in-depth report from Development Initiatives called “Investments to End Poverty” which was launched as world leaders met to discuss the future of global development goals in New York last week at the UN General Assembly.
This particular graphic reveals that although resources to end poverty are increasing and changing, aid is still crucial for the poorest.
Resources available to poor countries have more than doubled over the last decade and considerably changed. While foreign direct investment, remittances and loans have significantly increased, the number of developing countries where official development assistance (ODA) is the largest resource has more than halved from 95 to just 43. But aid remains the largest resource for the poorest countries, mostly in sub-Saharan Africa.
Another data visualisation shows how aid is not a simple transfer of cash from a donor to a recipient country.
Too often aid is seen as a simple transfer of cash from a donor to a recipient country. Aid comes in a variety of forms: cash, loans, food or other goods, and expert advisors, etc. Moreover, a large part of aid never actually leaves donor countries. The money is spent on activities within the donor country like supporting students from developing countries or cancelling debt.
At least $22 billion of the $100 billion-plus aid reported as bilateral aid in 2011 was never transferred to poor countries. This is about 20%! For example, both Denmark and Italy reported giving over $2 billion in bilateral aid in 2011. More than two-thirds of Denmark’s aid was transferred to developing countries. By contrast, more than two-thirds of Italy’s aid, mainly debt relief or housing refugees, stayed in Italy.
Similarly of the $7.5 billion reported as being given the Democratic Republic of Congo (DRC) in 2011, more than $5 billion never reached the country and went towards the cancellation of debts.
The report also includes a projection of future poverty distributions which is covered in this blog post.
Explore the data visualisations in more detail at Development Initiatives or download the full report.


