The latest official development assistance (ODA) data for 2018 show there is a lot of room for improvement: total aid is not remotely enough, the countries and regions most in need still do not receive the majority of aid, and gender blind projects are still the norm.
But there are also some positive trends that should be highlighted and continued.
Here’s an overview of what the statistics tell us about last year’s US$153 billion aid budget, including how and where the money was spent.
Aid decreased for the second year in a row. But the devil is in the detail: many donors increased their investments
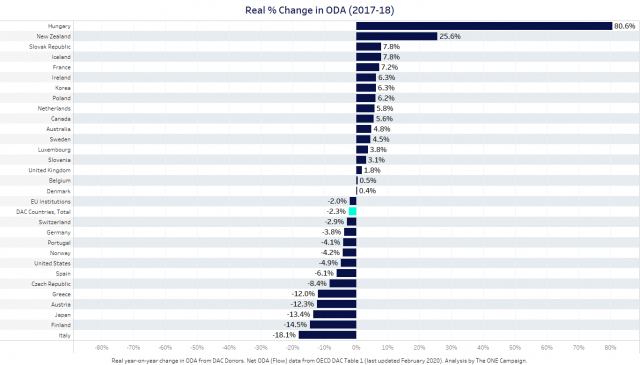
Comparing 2018 aid to previous years is complicated (total ODA is measured differently starting in 2018), but one thing is certain: controlling for changes in prices and exchange rates, donors invested about 2% less in aid than in 2017. In other words, total ODA went down in real terms by some US$3.6 billion.
CHECK OUT OUR INTERACTIVE TOOL
Explore the data
As we start what must be a decade of delivery for the Sustainable Development Goals (SDGs), this is bad news. In order to close the projected SDG investment gap of almost US$360 billion per year in low-income countries in 2030, aid should be increasing rapidly. And yet, donors fell a staggering US$199 billion short of their commitment to provide 0.7% of their gross national income as ODA.
But not all donors performed equally: 17 out of 30 provided more aid in 2018 than they did in 2017. This includes France (+7.2%), the Netherlands (+5.8%), Canada (+5.6%) and the UK (1.8%). However, these increases were not large enough to offset the very significant decreases from the US (-5%, or US$1.7 billion) and Germany (-4%, or US$1 billion).
Less aid is staying in donor countries than before
The good news is that more aid is actually being spent outside donor countries. Our Better Aid Scorecards track how much “core” ODA donors provide. By this we mean total aid, excluding money spent in donor countries on refugees, university students, or debt relief. Core ODA went up by 0.4% in 2018, and it reached 90.4% of total ODA (up from 85.2% in 2016).
This is, in part, thanks to a substantial decrease in in-donor refugee costs (IDRC) in most countries — including by US$2.7 billion in Germany alone. To a certain extent, this is expected: the OECD Development Assistance Committee (DAC) only allows for expenses linked to hosting refugees and asylum seekers to be counted as ODA in the first year since their arrival. However, France (+22%), Spain (+20%), the US (+9%) and Canada (+5%) all went against the general trend and actually spent more on refugees in 2018 than in 2017.
A larger share of aid is being targeted to the countries and regions with the greatest needs
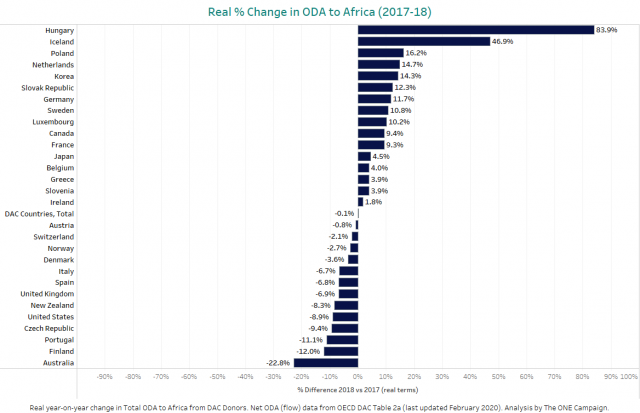
A greater share of aid went to Africa, least developed countries (LDCs) and fragile states for the second year in a row. Aid to Africa totalled US$51 billion in 2018, aid to LDCs US$46 billion (+3% in real terms), and aid to fragile states US$63 billion (+3%).
This should almost be seen as a victory — especially after many years when the trend was the opposite. But donors are far from spending the majority of their aid in these places, even when extreme poverty is projected to be overwhelmingly concentrated there by 2030.
On average, DAC donors spent 34% (+0.6%) of aid in Africa, 31% in LDCs (+1.4%), and 43% in fragile states (+1.9%).
The bad news is that while many increased their investment, some donors spent significantly less in Africa compared to 2017. In real terms, the US provided 9% less ODA to Africa, and the UK, Spain, and Italy all provided 7% less.
More aid is being spent in support of gender equality and women’s empowerment
In 2018, just over US$45 billion, or about 44% of bilateral allocable aid from DAC donors and the EU institutions, focused on gender equality as either a significant or a principal objective. This is aid tracked using the DAC gender markers, which assess whether, regardless of their sector, projects have a positive impact on advancing gender equality, reduce gender discrimination, or meet gender-specific needs.
This represents an increase of over 15% in real terms, or about US$5 billion more invested in projects that contribute to gender equality. In 2018, three donors (Canada, Iceland, and Sweden) provided over 80% of their bilateral allocable aid to gender and 12 donors now provide at least 50% of their aid to gender (+3 compared to 2017).
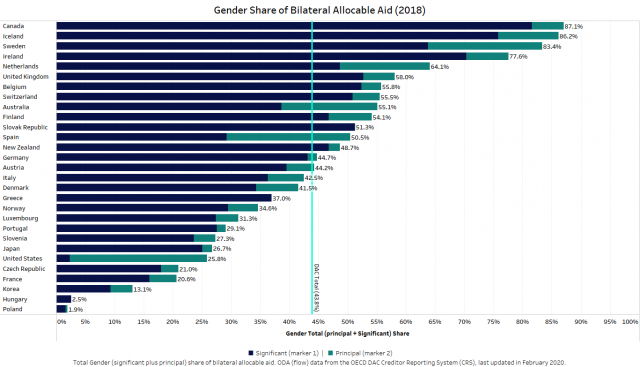
However, even though this is a positive trend, over half of bilateral allocable ODA remains gender-blind. This is a big issue because gender-blind programmes are less effective, since they are not likely to equally benefit the most vulnerable.
Additionally, more research is needed to assess whether this positive trend is the result of increased pressure to “mark” projects as gender sensitive rather than a real policy change in terms of how gender equality is considered and incorporated into projects. As a recent Oxfam study shows, while self-reported contributions to gender equality have increased, it is not clear that this funding is actually for gender equality work. The report also found concerning issues with how donors are reporting these numbers.
Interested in more analysis?
Stay tuned for more analysis on where aid money is going and which sectors are being prioritised by donors. To explore the data yourself, check out our new aid dashboard.
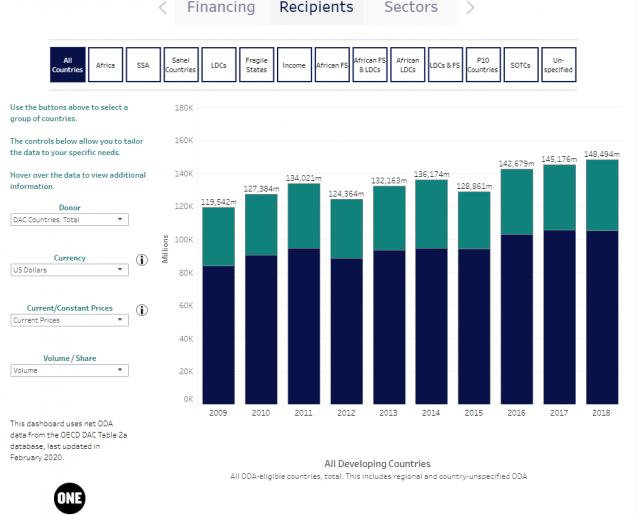
CHECK OUT OUR INTERACTIVE TOOL